Swansea's monitoring stations
If you are requesting data (in any format i.e. csv or pdf) please ensure that info.swansea.airqualitydata.com is added to your email systems "whitelist". If not, you may find that the emails are either not delivered or placed in your "junk" or "spam" folders.
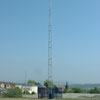
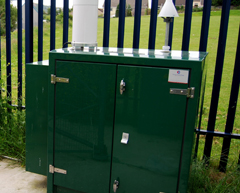
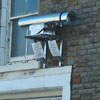
There are currently eight monitoring stations (both air quality and meteorological) that are providing data for swansea.airqualitydata.com
Please note that all data is displayed as Greenwich Mean Time (GMT) and may therefore appear to be 2 hours "old" during the summer months. Also, please note that should the last date/time update show for example " Last updated: GMT 26 Jan 2010 09:00" this means the data displayed is for the period 09:00 to 10:00. The next update will reflect the period 10:00 to 11:00 etc etc
Please click on each of the sites below to find out where they are located and what is measured at each station.
|
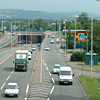
Monitoring station: |
Monitoring station: |
Monitoring station: |
 |
 |
 |
|
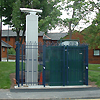
Monitoring station: |
Monitoring station: |
Monitoring station: |
 |
 |
 |
|
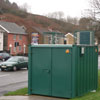
Monitoring station: |
 |