Font size too small?   Increase Font size | Decrease font size | See other Accessibility Options.
Index Banded Annual Totals for Swansea:
LOW
161 days
MODERATE
39 days
HIGH
1 day
VERY HIGH
5 days

Annual Air Pollution for 2007


Annual Air
Pollution Totals for:
Swansea
LOW
307 days
MODERATE
50 days
HIGH
6 days
VERY HIGH
2 days

Historical data:
Please select a year CURRENT YEAR | 2023 | 2022 | 2021 | 2020 | 2019 | 2018 | 2017 | 2016 | 2015 | 2014 | 2013 | 2012 | 2011 | 2010 | 2009 | 2008 | 2006 | 2005 | 2004 | 2003 | 2002 | 2001


Annual Air
Pollution Totals for:


Annual Air
Pollution Totals for:


Annual Air
Pollution Totals for:
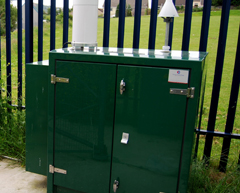
photograph of monitoring station: Cwm Level Park Ozone and NOx - illustrative purposes only
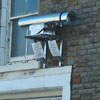
photograph of monitoring station: Hafod OPSIS DOAS - illustrative purposes only
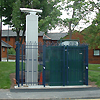
photograph of monitoring station: Morriston Groundhog - illustrative purposes only

There are no annual totals for this year for this station

LOW
363 days
MODERATE
2 days
HIGH
0 days
VERY HIGH
0 days

LOW
341 days
MODERATE
21 days
HIGH
3 days
VERY HIGH
0 days


Annual Air
Pollution Totals for:


Annual Air
Pollution Totals for:
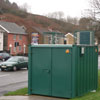
photograph of monitoring station: St Thomas DOAS - illustrative purposes only
photograph of monitoring station: Swansea AURN - illustrative purposes only
LOW
340 days
MODERATE
25 days
HIGH
0 days
VERY HIGH
0 days

LOW
347 days
MODERATE
18 days
HIGH
0 days
VERY HIGH
0 days